Performance monitoring is at the centre of any continuous improvement strategy. But too many companies focus exclusively on traditional sales KPIs, such as for example the average basket, the number of orders, the rate of active customers or revenue. Although they are essential, you can deepen your understanding of the activity with customer satisfaction indicators....
Performance monitoring is at the centre of any continuous improvement strategy.
But too many companies focus exclusively on traditional sales KPIs, such as for example the average basket, the number of orders, the rate of active customers or revenue.
Although they are essential, you can deepen your understanding of the activity with customer satisfaction indicators.
In this article, we will take a look at why it is important to enrich your Salesforce performance reports with these kind of indicators and how to proceed.
Why monitor satisfaction indicators in the same way as other sales KPIs?
There are two main indicator categories. Firstly, quantitative indicators that measure your company’s activity and its evolution over time. These indicators are used to measure sales performance. Sales KPIs are very varied.
They differ depending on whether your activity is B2B or B2C, but also according to the nature of your activity. The revenue, average basket, number of sales, number of signed contracts, conversion rates or customer lifespan are a few examples of sales KPIs.
These indicators are essential. They are objective, unambiguous, and precise. But they have a flaw; a very low explanatory power.
They allow you to observe numbers and evolutions, but they do not help you understand the reasons behind them. For example, why did your revenue drop by 30% during the last quarter? Sales indicators cannot provide an answer. Only a change in granularity can partially explain these variations; a localised decrease in a region, increased sales for one particular product, etc.
For this reason, it is strongly recommended to use satisfaction indicators too: Net Promoter Score, Customer Effort Score (CES), Customer Satisfaction Score (CSAT), etc.
When integrated into your Salesforce reports, these indicators can:
- Allow you to better understand the causes of the variations to your sales activity indicators.
- Help your sales team to adopt a new viewpoint (the customers’) and identify new areas for improving sales performance.
- Feed into other Salesforce Suite applications, in particular Service Cloud.
For all these reasons, we highly recommend integrating satisfaction indicators into your Salesforce dashboards and reports.
How to obtain and integrate customer satisfaction indicators into Salesforce?
We will now set out the steps to follow for integrating satisfaction indicators into your Salesforce reports. As you will see below, it is relatively simple.
Step 1 – Collect results via an Enterprise Feedback Management platform
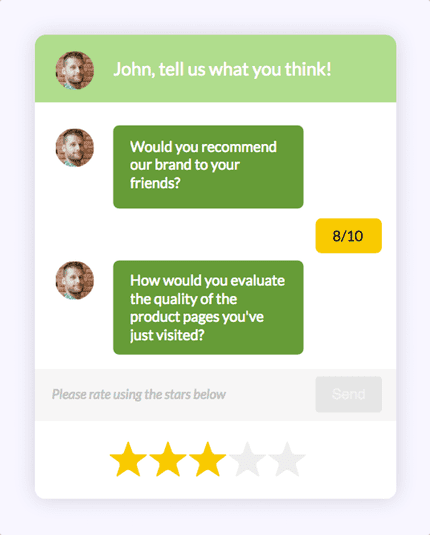
You need to collect scores before integrating them into Salesforce. How? By using an Enterprise Feedback Management platform. MyFeelBack for example, allows you to deploy smart cross-channel surveys to your customers and collect customer feedback in real time.

Example of a smart survey, in a ChatSurvey format, to collect the satisfaction level and customer data
Step 2 – Synchronise the data in Salesforce
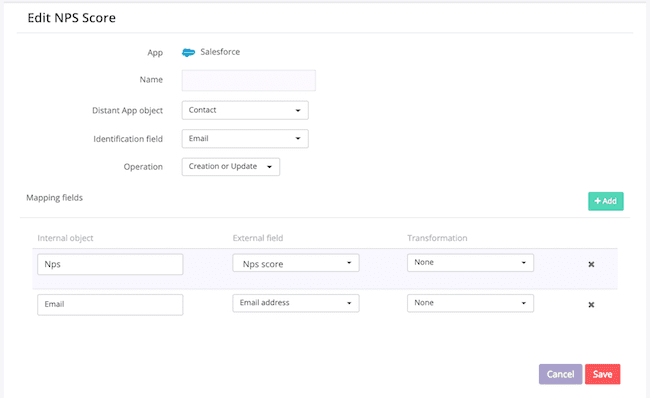
You must then synchronise the collected data with your Salesforce CRM, by using your Enterprise Feedback Management platform. This requires the implementation of mappings. Mapping consists in associating your survey answer fields with objects in your Salesforce CRM.
Mapping rules allow to synchronise your survey data with your CRM automatically, in real time and in the right place.

Mapping between Salesforce and MyFeelBack
This data can be incorporated into your contact records, in which case you simply need to create the corresponding custom fields. If you are in B2B, it’s exactly the same thing; you can feed data related to the customer satisfaction indicators into your company records.
Discover How to enrich Salesforce with qualified data.
This data can also feed into your Salesforce dashboards. To do so, simply create custom objects in Salesforce that will enable you to include all the indicators on one dashboard. For example, in the context of a CSAT indicator, a custom object will allow you to measure the rates of satisfied and dissatisfied people.
Step 3 – Build your Salesforce dashboard with satisfaction indicators
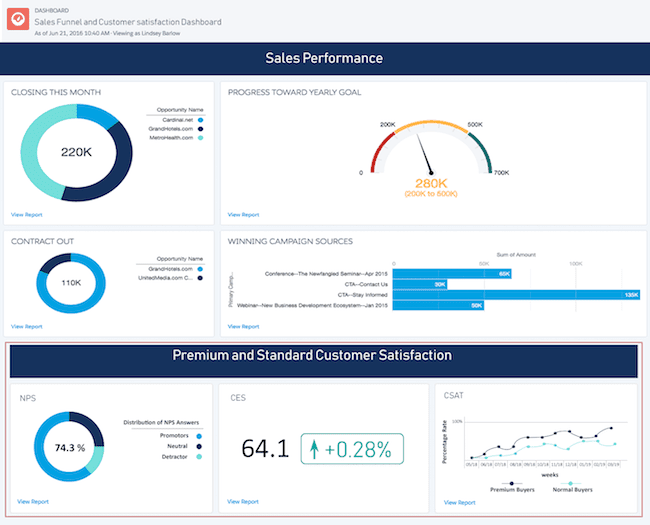
Multiplying satisfaction indicators can be redundant and make your dashboard more difficult to read. We recommend integrating 2, or 3 at the most. Don’t forget that in terms of satisfaction, the rating itself is not what counts the most, but its progression. This should be reflected on your dashboard, by calculating percentage changes and displaying scores via curves over time periods.

Salesforce dashboard linking satisfaction data with sales data
To find out more, discover How to integrate the NPS into Salesforce CRM.
Satisfaction scores have several granularities. You can navigate using filters to better understand the level of customer satisfaction with regards to a department, region or even customer service agent. To make it easy to explore the data through these filters, build your nomenclature in a way that is clear and understandable for all users.
You will find all the information required to synchronise data collected via MyFeelBack surveys with your Salesforce CRM in our Help Centre. MyFeelBack has developed a Salesforce connector to make your life easier. If you are a MyFeelBack and Salesforce user, we strongly advise you synchronise both systems.


